
In this article we teach you how to open and close trades based on 11 fundamental trading patterns for trading the financial markets11 Chart Patterns for trading in financial markets. Learn how to open and close trades in a timely and profitable manner11 Chart Patterns for trading in the financial markets
The importance of charts in trading
If you want to succeed in trading, you have to know how to read charts. It’s not optional, it’s essential. Charts are not just lines that go up and down: they are maps of market decisions, emotions and trends. Each candlestick, each pattern, tells a story about supply and demand, about who is in control: buyers or sellers.The importance of charts in trading
Trading without understanding charts is like driving with your eyes closed. In contrast, mastering chart patterns gives you a real advantage. It allows you to anticipate, recognize opportunities and act more accurately. It’s not about guessing the future, it’s about increasing the odds in your favor.
11 chart patterns that every trader should know
Chart patterns are visual representations of market behavior. They reflect the balance (or imbalance) between buyers and sellers. Detecting them in time can make the difference between a random trade and one with high technical potential. Here we present the eleven most relevant:11 chart patterns that every trader should know
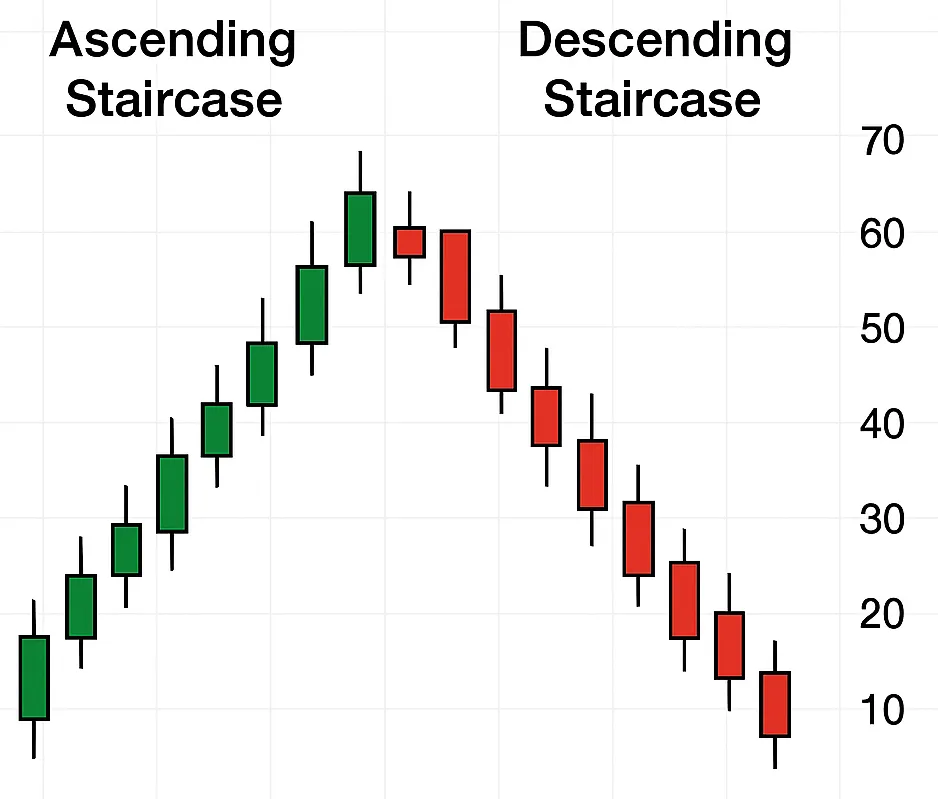
1. Ascending and descending stairs
These patterns reflect a solid trend with staggered movements.
- In the ascending staircase, the price forms a sequence of higher highs and higher lows. Each correction remains above the previous level, indicating continued buying strength.
- In the downward staircase, the opposite is true: each bounce is below the previous one, a sign of sustained selling pressure.
These patterns are useful for trend following and entering well-defined pullbacks, with low risk.
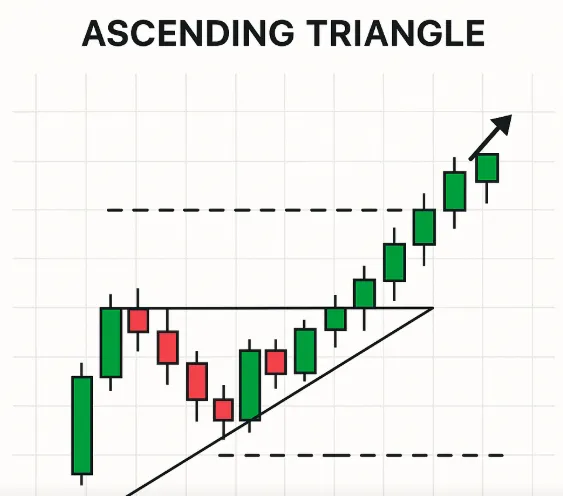
2. Ascending Triangle
This pattern appears when the price encounters clear horizontal resistance, while the lows are getting higher and higher. The interpretation is that buyers are pushing harder on each pullback, and are willing to pay higher and higher prices.
When the resistance line is broken, there is usually an acceleration of the upward movement. It is a continuation pattern, typical in uptrends.
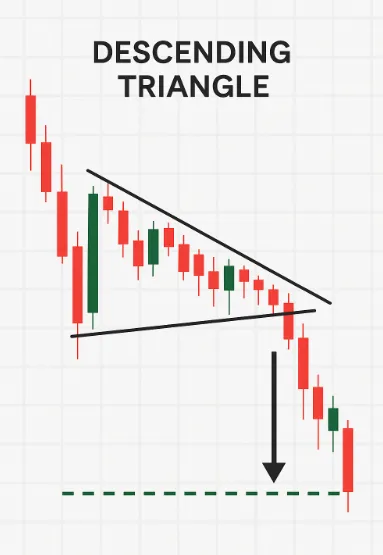
3. Descending Triangle
This pattern shows increasing selling pressure. The support line remains stable, but the highs are lower and lower. It is interpreted as a sign of price weakness. If support is broken, a stronger downward movement will most likely be initiated.
It usually appears in downtrends as a continuation pattern, although it can also mark a reversal if it is broken to the upside.
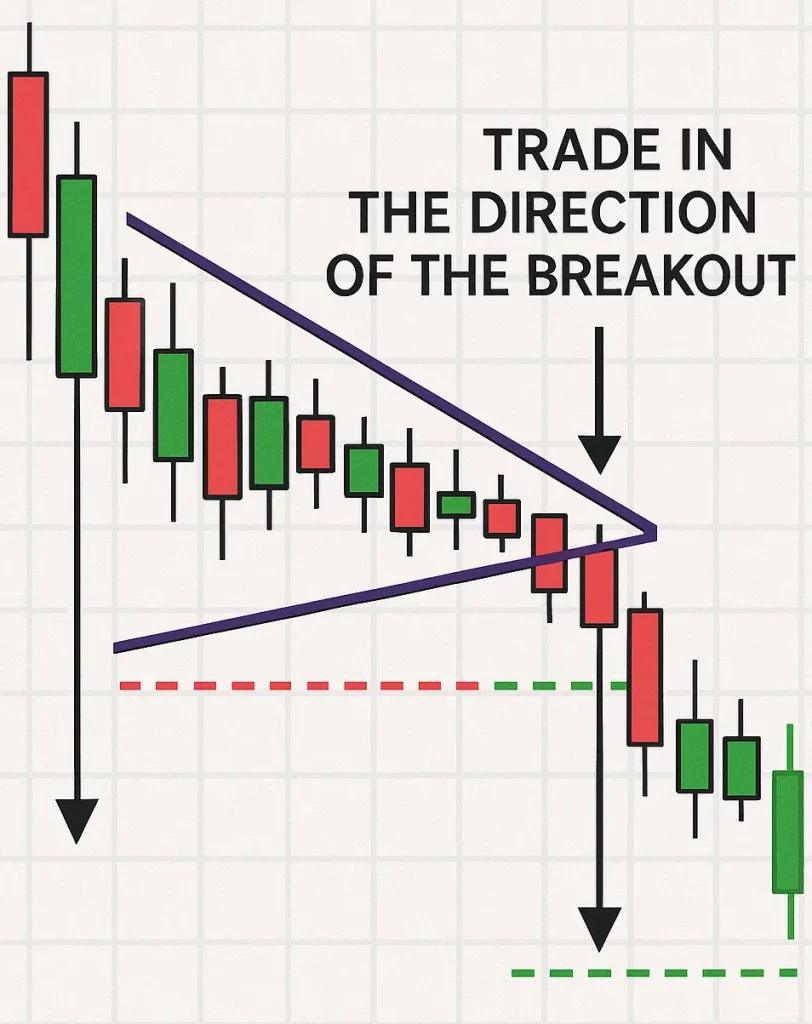
4. Symmetrical Triangle
It is formed when the highs go down and the lows go up, drawing a triangle that closes over time.
It reflects a consolidation phase and temporary balance between buyers and sellers.
This pattern is neutral until it is broken. A breakout with volume can initiate a strong move in the direction of the breakout. The key is not to anticipate, but to wait for confirmation.
Flag
It appears after a sharp movement, either upward or downward.
- The initial impulse generates a strong price movement.
- The market then enters a brief pause, with a channel sloping in the opposite direction of the previous trend (this forms the “flag”).
A break in the direction of the original impulse usually anticipates a continuation of the move. Flags are highly reliable patterns when correctly identified, appearing after a sharp move, either up or down.
The initial impulse generates a strong price movement.
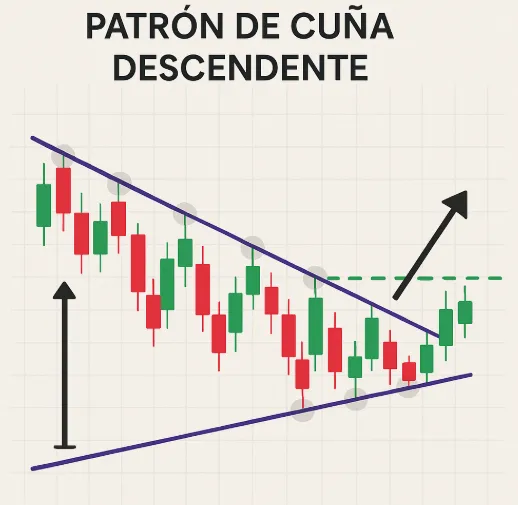
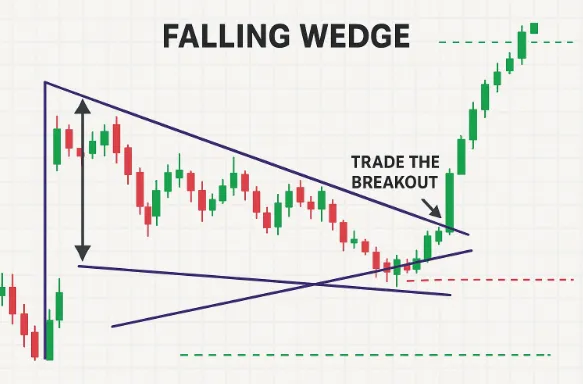
Wedge
Visually, it is similar to a triangle, but with both lines inclined in the same direction (ascending or descending) and converging.
- In an ascending wedge, the lows and highs rise, but at a weakening rate. It usually anticipates a bearish reversal.
- In a falling wedge, prices fall with decreasing strength, and may mark the end of a downtrend.
It is key to analyze the volume: when it decreases during the wedge formation and increases when the wedge breaks, the signal becomes stronger.In a rising wedge, the lows and highs rise, but at a weakening pace. It usually anticipates a bearish reversal.
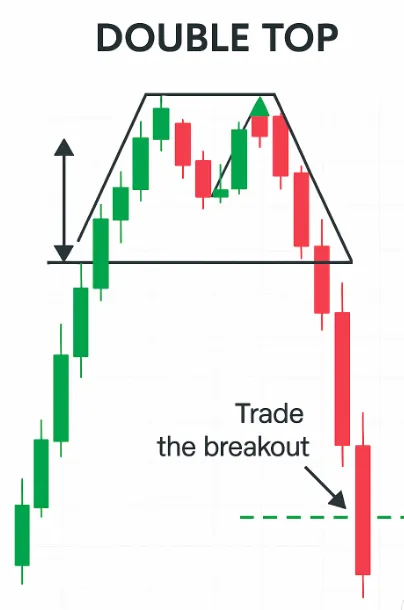
Double Top
Bearish reversal pattern. It is formed when the price reaches the same resistance level twice, but fails to overcome it.
Between the two peaks, the price falls back to a support level, called the “neckline”. If this line is broken, the pattern is confirmed.
The psychology behind it: buyers try to take control twice, but fail. This usually marks the beginning of a trend change.
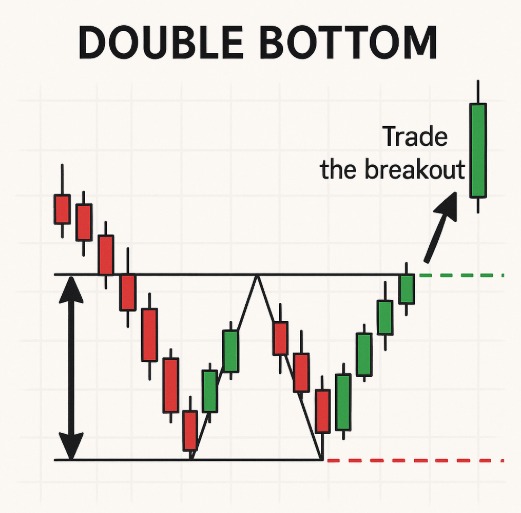
Double Bottom
This is the bullish version of the double top. The price finds support at a given level twice, forming a “W” figure.
The pattern is completed when it breaks the resistance formed between the two floors.
It indicates that the selling pressure has lost strength and that there is buying interest at that key level. It usually marks a trend reversal in oversold areas.
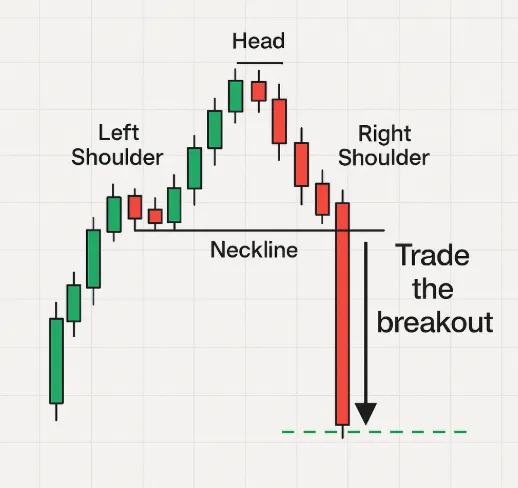
Head and Shoulders
One of the most reliable bearish reversal patterns. It consists of three peaks:
- The first (left shoulder), the second highest (head) and the third lowest (right shoulder).
- The “neckline” connects the lows between the peaks.
When this line is broken with volume, the bearish signal is triggered.
There is also the Inverted Shoulder-Head-Head-Shoulder, which signals a reversal to the upside.
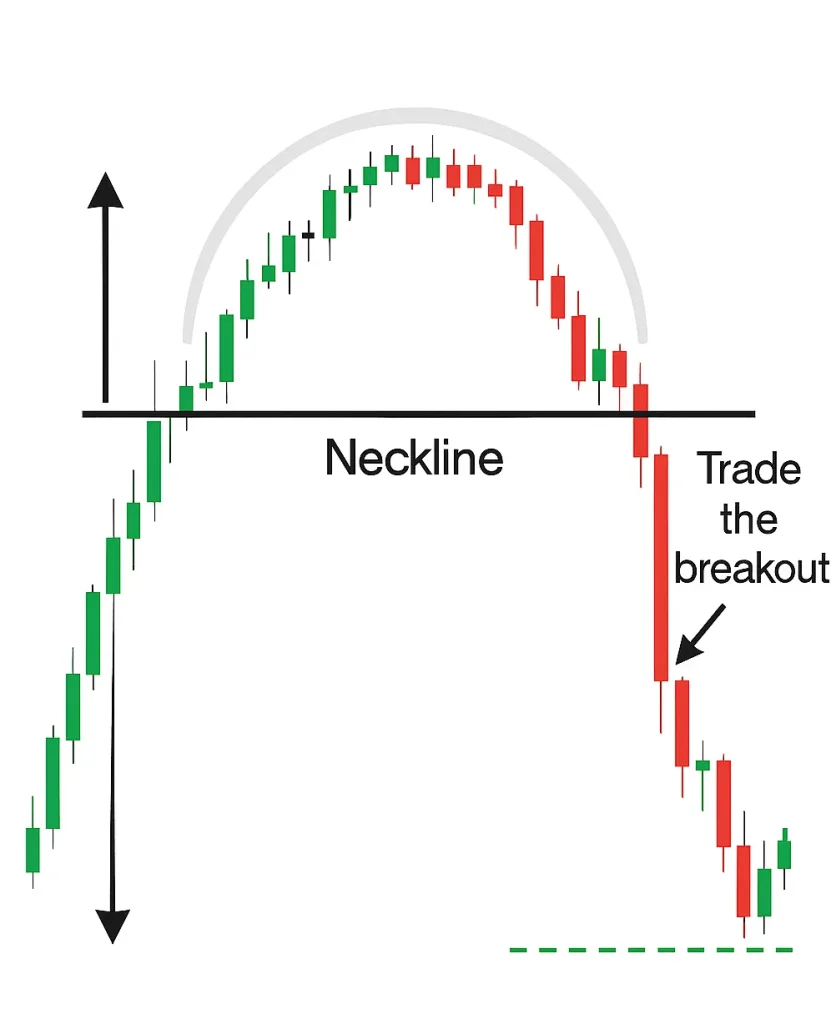
Rounded Top/Bottom
They are broad formations that mark a gradual change of direction.
- The rounded ceiling indicates that buying interest is progressively weakening.
- The rounded floor reflects a gradual transition from selling to buying dominance.
These patterns form over longer time frames and require patience, but usually give sustained, long-term signals of change.The rounded ceiling indicates that buying interest is progressively weakening.
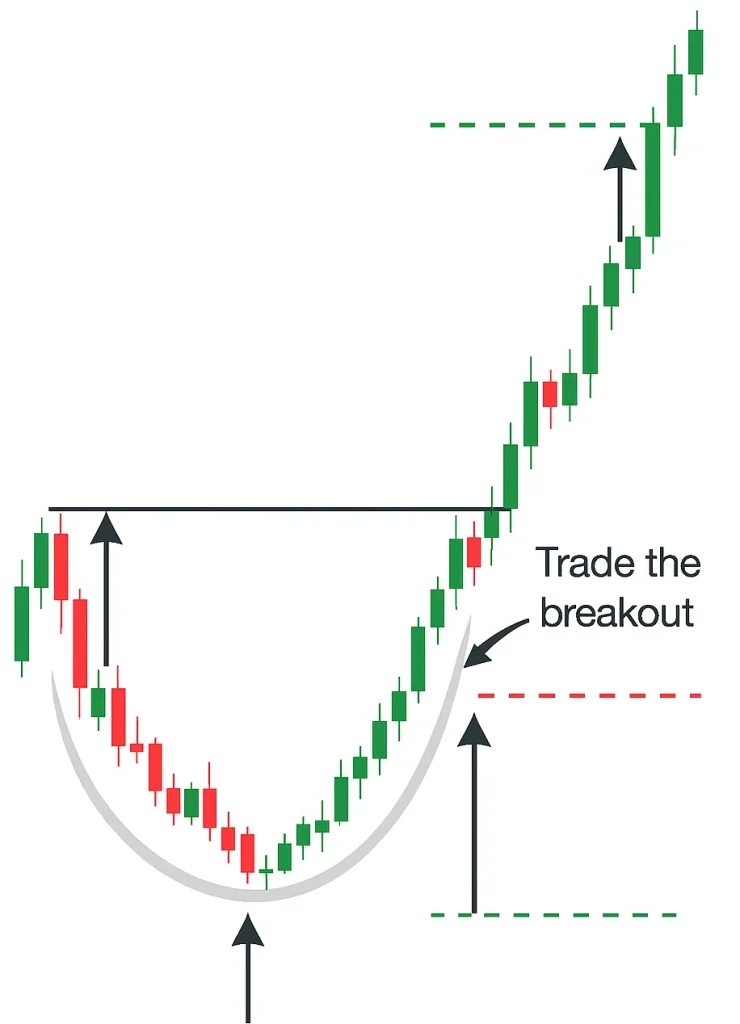
Cup and Handle
This pattern is characterized by a “U” shape followed by a small “handle” consolidation.
The “cup” shows a mild correction phase, while the “handle” represents a pause before a possible bullish breakout.
When the price breaks the upper resistance of the handle, it is interpreted as a trend continuation signal with considerable upside potential.
It is widely used in stock analysis, but also appears in cryptocurrencies and other instruments.
How to trade with graphic patterns?
Recognizing a chart pattern is only half the job. To trade effectively, you need a plan: confirmation, risk management and clear definition of objectives. Here’s how to execute each step in depth. How to trade chart patterns.
1. Confirmation of the pattern: do not operate what does not yet exist.
One of the most common mistakes is to trade a pattern “in formation”. The market may suggest a pattern, but until it breaks a key level, it is only a possibility.
What is considered a confirmation?
- Decisive breakout with a wide candle and close outside the structure.
- Volume increase.
- Pullback/throwback to the broken zone.
The cleaner and more defined the pattern, the more reliable it will be. Avoid trading forced patterns or patterns with too much volatility.
2. Stop Loss: your only real defense
In trading, losing is part of the game. The important thing is to limit how much you lose. A well-placed stop loss protects your account and allows a bad trade not to take you out of the market
Where to place it?
- Outside the pattern.
- At the last relevant low or high.
- At support/resistance zones or important moving averages.
Do not fall into the trap of the “emotional stop” (placing it closer to risk less). This increases the probability of being taken out of the trade prematurely.
3. Profit target: It’s not a guess, it’s a strategy.
The earnings target should be technically justified, not based on desire. Estimating a target helps maintain discipline and avoid impulsive exits.
Ways to establish it:
- Projection of the height of the pattern from the break point.
- Fibonacci extensions (1,272, 1,618).
- Previous support/resistance zones.
- Minimum risk/benefit ratio 2:1.
Advanced: Consider partial profit taking and trailing stop to capture extended moves.